

What Is India VIX? How to Read the Fear Gauge Simply
What is India VIX? Learn how NSE's volatility index is worked out, how to turn it into a rough 30-day Nifty range with a ₹ example, and what high or low means.

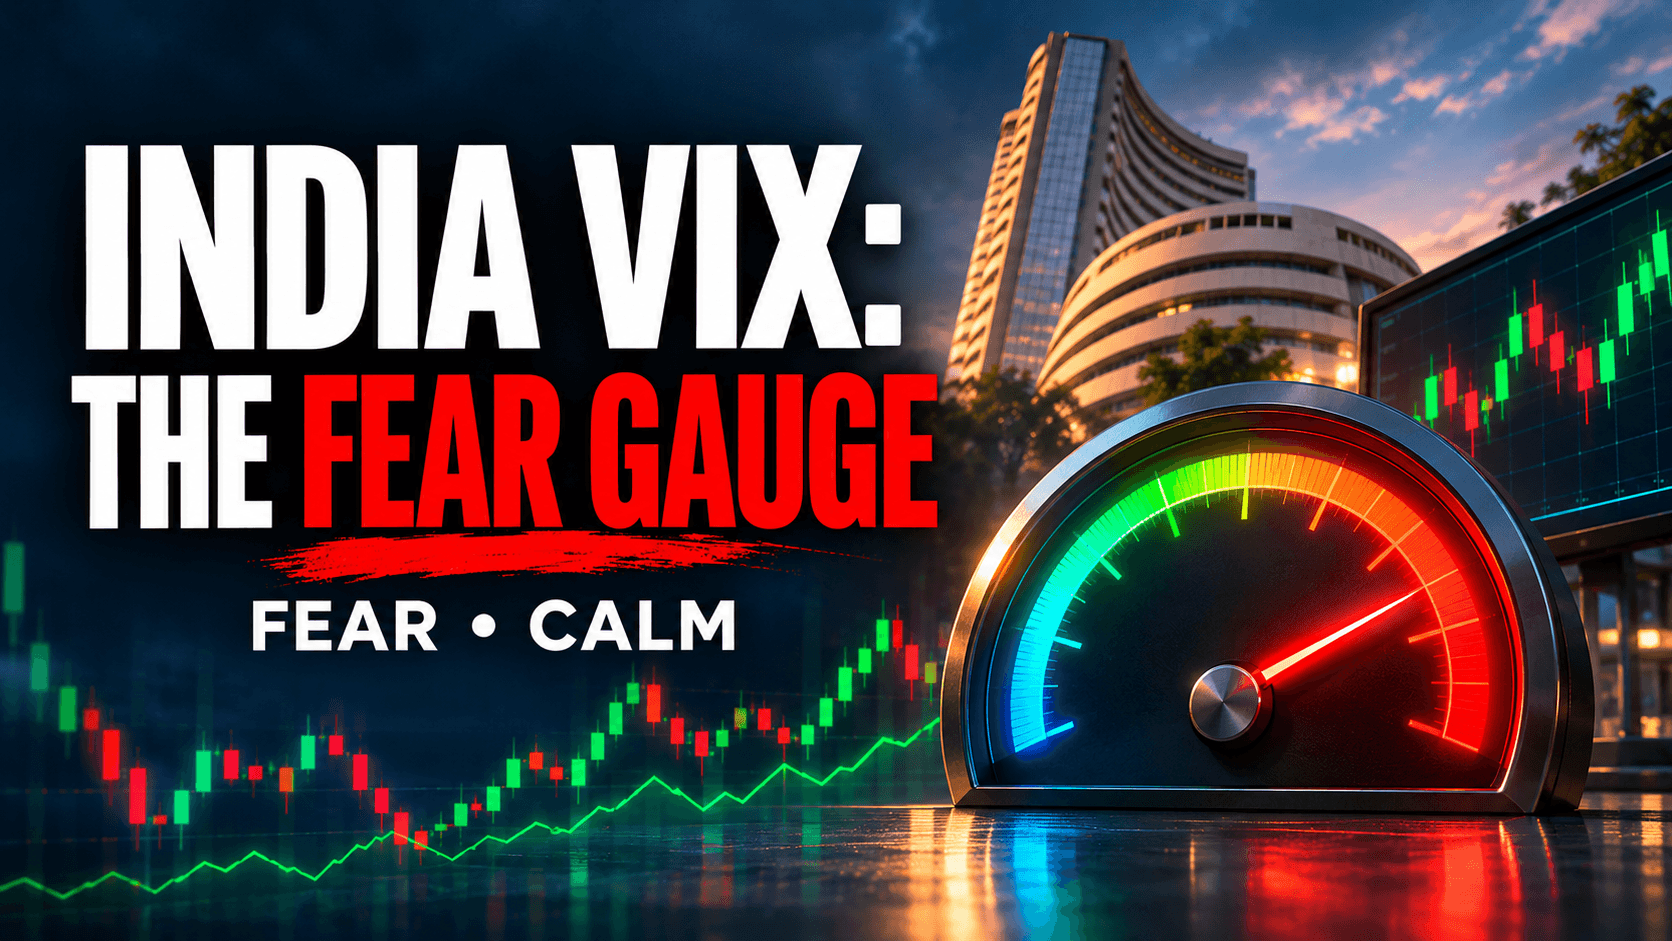
What is India VIX? India VIX is a number published by the NSE that shows how big a move traders expect in the Nifty 50 over the next 30 days. A higher number means traders expect bigger swings. A lower number means they expect calmer days.
People call it the fear gauge, but that name is a little unfair. It does not say whether the market will go up or down. It only says how bumpy the ride is expected to be.
In this guide you will learn how India VIX is worked out, how to turn the number into a rough rupee range with a simple example, what high and low readings mean, and the mistakes beginners make with it.
What is India VIX?
VIX stands for volatility index. Volatility means how much and how fast a price moves. A share that jumps 3% one day and falls 2% the next is more volatile than one that moves 0.2% a day.
The NSE launched India VIX in 2008, as its press release dated 8 April 2008 shows. It follows the method of the CBOE, the American exchange behind the original VIX, adapted for the Nifty options market, as described on NSE's India VIX page.
The number is quoted as a percentage a year, but it describes the next 30 calendar days. That sounds odd at first, and the example below makes it clear.
How is India VIX calculated?
India VIX is not made from the Nifty's past prices. It is made from the prices traders are quoting today for Nifty 50 options, contracts whose value changes when the Nifty moves.
Think of an option as insurance on the Nifty. When people expect a rough month, the insurance costs more. When they expect a calm month, it costs less. The NSE takes the best bid and ask prices in the Nifty options order book for the near and next expiry, and works out how much volatility those prices imply.
So India VIX looks forward. It is the market's guess about the next 30 days, not a report on the last 30. The NSE publishes the full formula in its methodology document, so you do not need to work it out yourself.
How to read India VIX with a ₹ example
Here is a simple rule. To turn the yearly number into a 30-day range, multiply it by 0.287, which is the square root of 30 divided by 365.
Imagine the Nifty is at 25,000. This is an example, not today's level. The table shows what different India VIX readings mean for that Nifty.
| India VIX | Expected 30-day move | In Nifty points (Nifty at 25,000) |
|---|---|---|
| 12 | About 3.4% | About 860 points |
| 16 | About 4.6% | About 1,147 points |
| 20 | About 5.7% | About 1,433 points |
| 25 | About 7.2% | About 1,792 points |
Take a reading of 16. The market expects the Nifty to stay within about 4.6% either side of where it is now, roughly 1,147 points on 25,000. That is a rough guide for about two out of three months. The Nifty can and does move more than that.
You can repeat the same sum with the latest reading. Check the current number in the Market Sentiment Index on RupeeVerse, multiply by 0.287, and you have the expected 30-day move.
What does a high or low India VIX mean?
When India VIX is high
- Traders expect big moves, up or down.
- Options cost more, because the insurance is in demand.
- It often rises around big events such as the Budget, elections, global shocks and RBI policy decisions on the repo rate.
When India VIX is low
- Traders expect calmer days.
- Options cost less.
- Calm can end suddenly, so a low reading is not a promise of a quiet market.
There is no official line that separates high from low. Compare today's reading with the last few weeks, not with a fixed number.
India VIX today on RupeeVerse
RupeeVerse reads India VIX every day and uses it as one of the six parts of its Market Sentiment Index. In the latest reading, taken on 4 November 2026, India VIX was 15.72. That works out to an expected 30-day move of about 4.5%. The index score for the day was 42.1.
The live card below shows the current reading.
Open the Markets page to see the Nifty and sector moves next to it, along with FII and DII flows for the day.
Common mistakes with India VIX
- Thinking India VIX shows direction. A high reading says moves are expected to be big, not whether they will be up or down.
- Thinking a low reading means safe. Calm periods can end suddenly.
- Mixing it up with the Nifty's price. India VIX is a separate index and can rise while the Nifty is also rising.
- Using it for a single share. It describes the Nifty 50, not an individual company.
Key takeaways
- India VIX shows how big a move traders expect in the Nifty 50 over the next 30 days.
- It comes from Nifty option prices, so it looks forward, not back.
- Multiply the reading by 0.287 for a rough 30-day range, and remember it is a guide, not a promise.
- It says nothing about direction, so compare today's reading with the last few weeks.
To see how steady monthly investing is worked out whatever the market does, read what a SIP is and try the SIP calculator.
Frequently asked questions
What is a good India VIX level?
There is no official good or bad level. A lower reading means traders expect calmer days and a higher one means they expect bigger swings, so compare today's number with its own recent past.
Is India VIX the same as the Nifty?
No. The Nifty is the price level of 50 large companies. India VIX is a separate index that measures how big a move traders expect in the Nifty over the next 30 days.
Does a high India VIX mean the market will fall?
No. A high reading means traders expect big moves, but those moves can be up or down. India VIX shows the size of the expected swing, not its direction.
Where can I see India VIX?
The NSE publishes it on its website through the trading day. RupeeVerse also shows it on the Markets page, inside the Market Sentiment Index.
Sources
This article is for learning only and is not investment advice. RupeeVerse is not a SEBI-registered investment adviser or research analyst. Please do your own research, or speak to a SEBI-registered adviser, before you invest.
Try the tools
Keep reading
 How to Check if an Investment Adviser Is SEBI RegisteredHow to check if an investment adviser is SEBI registered: use SEBI's official list, match the INA or INH number, spot red flags and know where to complain.
 Nifty vs Sensex: What Is the Difference? A Simple GuideNifty vs Sensex: what is the difference? Learn how many companies each has, why their numbers differ, how they are calculated and what it means for index funds.
 Why Is the Stock Market Up Today? Nifty, Sensex Up 2%Why is the stock market up today? On 5 November 2026 the Nifty rose 2.40% and the Sensex 2.60%. See four reasons: crude oil, FII money, global cues, earnings.